Sample conditioning is a key element for measurement repeatability as variations in temperature and moisture content can contribute to variations in measurement data, but not all fabrics and colors respond in the same way to these environmental variations. The variety of colors and number of fabric types typically produced and evaluated by textile manufacturers and retailers excludes the possibility of occasional control of relative humidity and temperature for specific colors or fabric types. Instead, environmental conditions must be specified and continually controlled so as to minimize color variation for all samples to be evaluated. This is especially significant when samples are measured at various locations globally where environmental conditions may vary dramatically.
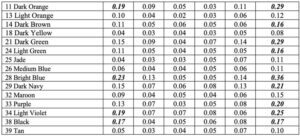
ASTM guidelines for conditioning of textile samples are detailed in ASTM standard D1776-98 “Standard Practice for Conditioning and Testing Textiles”. This standard specifies a temperature of 21 +/- 1° C and 65 +/- 2% relative humidity (RH) for the conditioning of textile samples. A series of experiments was performed using 100% cotton standards to determine the effects of variations in temperature and relative humidity on associated color differences. The following tables detail the DE CMC (2:1) color differences in D65/10 between selected experimental samples at the stated conditions and the standard conditioned to the ASTM recommended values of 21°C and 65% RH. The experimental data in Table 4 was generated for variations in relative humidity while holding temperature constant, the experimental data in Table 5 was generated for variations in temperature while holding relative humidity constant, and the experimental data in Table 6 was generated for variations in both temperature and relative humidity. The last column of Tables 4 and 5 represent the color differences between samples conditioned at the extremes of temperature or relative humidity.

Table 4. Constant Temperature of 21°C with Variation in Relative Humidity
Analysis of the data in Table 4 indicates that for the samples tested, variations in relative humidity do not have a significant impact on measured color difference when temperature is held constant until the humidity drops to 40% RH. This represents a variance of 25% RH when compared to the standard relative humidity of 65%. The final column, which displays the color differences between the samples measured after conditioning to 40% RH and the samples after conditioning to 75% RH represents a variance of 35% RH, and as expected the color differences continue to increase. So while minor variations in relative humidity with constant temperature do not contribute significantly to color differences for the samples tested, larger variations in relative humidity contribute significantly to calculated color differences.


