Datacolor Tools Comes in Three Feature Levels
Datacolor Tools Basic
A powerful entry-level QC system without Form Editor and a reduced feature set. Additional templates and modified forms can be supplied by Datacolor’s application personnel at a separate charge and loaded into this level
Datacolor Tools Plus
Our premium, full-featured offering comprehensive color quality control package that includes complete tolerancing options, color evaluations for all color difference equations, plot options, whiteness, yellowness and staining indices, statistical analysis, and sample search capability, among other features. It also includes the option to customize the desktop layout and forms displayed on the screen and/or sent to the printer. This level features a Form Editor utility that can be used to create forms and procedures and update older forms from previous Tools versions.
Datacolor Tools Plus Workstation
Economical alternative as data viewing station for shared database, terminal server, or multiple system deployments. Provides all the color QC functionality of the Tools Plus level without the ability to create and store new data.
Get a Demo
Datacolor Tools Software Specifications
|
Tools Basic |
Tools Plus Workstation |
Tools Plus |
| LITE Mode |
|
|
|
| Configurable button bars |
|
|
|
| Hide menu bar/button bars |
|
|
|
| Screen forms |
Limited set of |
|
|
| Print forms |
Limited set of |
|
|
| File forms |
Limited set of |
|
|
| Multiple form display |
|
|
|
| Marks & Spencer setup |
|
|
|
| Manual curve adjustment |
|
|
|
| Manual gloss adjustment |
|
|
|
| Color Indices |
| Full range of Color Indices including: E313 Whiteness/Yellowness, Berger Whiteness, CIE Whiteness/Tint, Ganz-Griesser Whiteness, TAPPI 525 Brightness, R457 Brightness, GE PQSII Yellowness |
|
|
|
| ASTM Haze (4 measurements) |
|
|
|
| CMCCON97 Color Inconstancy |
|
|
|
| DIN 6172 Metamerism index- additive and multiplicative |
|
|
|
| APHA 10 Scale |
No form but in grid |
|
|
| Gray scale color change, Gray scale for staining |
No form but in grid |
|
|
| ISO 150-A06 Standard Depth |
No form but in grid |
|
|
| Statistics-std deviation, mean avg |
|
|
|
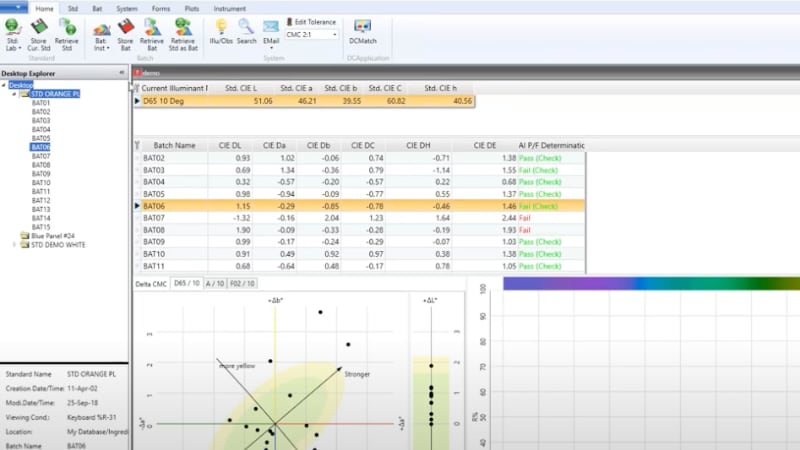
| Tolerances |
| CIE L*a*b*C*h* u*v*, CIE 94, CMC, CIE DE2000, GE PQS, M&S 89, FMCII, Hunter |
|
|
|
| Per-standard tolerances |
|
|
|
| Edit temperature tolerances |
|
|
|
| Datacolor, AI and Generic tolerancing |
No creation of new |
|
|
| New/Edit/Delete multiple tolerance blocks |
Limited selection |
|
|
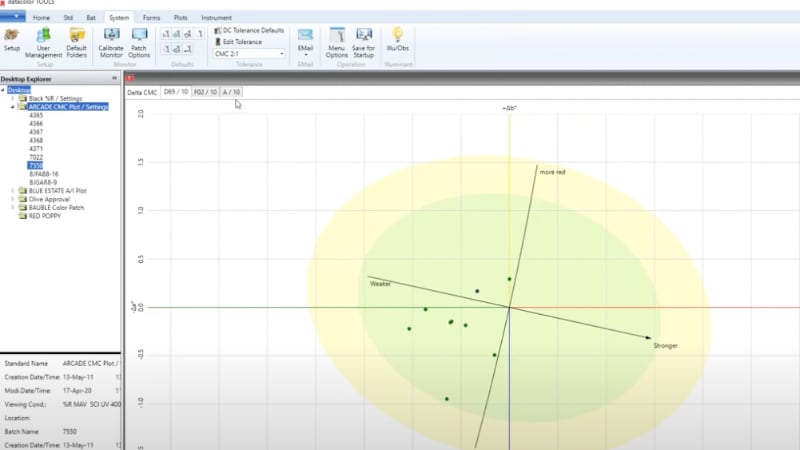
| Plots to support above Tolerances (2D and 3D) and absolute Trend and Histogram (NOt for generic Tolerances) |
|
|
|
| 3 Illuminant Plot display |
|
|
|
| Visualization |
| Envision Color Patch (new component) Color patch ( solid ) |
|
|
|
| Color patch ( Image File ) |
|
|
|
| Forms, templates and Business Fields |
| Form Editor |
|
|
|
| Text output, Edit boxes, List boxes, Buttons, Plots (new types) |
|
|
|
| User defined fields |
|
|
|
| Date Picker |
|
|
|
| Instruments & Data Management |
| Connect a wide range of Datacolor and competitive Instruments |
|
|
|
| Various methods for Standard/Batch entry Manual entry of %R / %T values, Color Coordinates |
|
|
|
| Storing data in the database |
|
|
|
| Swap standard/batch |
|
|
|
| Load standard as batch and batch as standard |
|
|
|
| Save modified Template as new |
|
|
|
| Create custom database fields |
|
|
|
| Use Procedures previously created |
|
|
|
| Save Screen for Startup |
|
|
|
| User Management |
| User Management Module |
|
|
|
| Create a new user |
No, only default ones |
|
|
| Customizing a user profile |
|
|
|
| Links and Output Options |
| Direct link to Formulation Packages |
|
|
|
| Direct link to TRACK and/or ENVISION |
|
|
|
| E-mail capability |
|
|
|
| Export to ASCII file |
|
|
|
| Miscellaneous |
| Terminal Server or Citrix Environment |
|
|
|
| Dynamic Sorting Module and Side-Center-Side Module |
|
Optional |
Optional |
Talk to a Color Expert
Software Maintenance Support
Maximize Efficiency with Continuous Updates
Ongoing access to the newest features and color technology improvements, keeping you current and operating at peak efficiency.
Ensure Smooth and Reliable Performance
Compatibility with the latest operating systems and database technologies through regular updates; prevent out-of-date legacy issues and ensure smooth, dependable color management process.
Safeguard Your Operation
Benefit from enhanced protection on the newest platforms and most advanced threat prevention capabilities.
Consult with a Color Expert
Access to Datacolor’s color experts via phone and email for assistance and expert advice, helping you maintain precision and efficiency in your operations.
Learn more about Software Maintenance Support
Customers on an active Software Maintenance Support plan can download the latest version of software.
*Active Software Maintenance Support plan required. Excludes installation, training, and on-site support
System Requirements
| Component | System Requirements |
| Operating System | Windows 10 and 11 (Pro or Enterprise Only) |
| Required Framework | Microsoft .NET Framework 4.7.2 or higher |
| Processor | Dual Core or higher (See Windows operating system requirements) |
| Memory | 8 GB or more |
| Hard drive | 500 GB
For ToolsSV: SSD 1 TB Min, 4 TB
|
| Display | 1920x1080 - size of text only 100% supported |
| Graphic card | Graphic card supporting OpenGL 2.1 |
| Connections | Serial, USB, Bluetooth or Ethernet (depending on spectrophotometer model) |
| Server OS | Windows Server 2016, 2019, 2022 |
| Additional Requirements | Only for Paint 2.X: SQL Server 2022
Only for Tools 2.X: SQL Server 2012 to 2019
|
| Internet Connection | Internet access recommended for software updates and license activation |
| LAN Connection | For ToolsSV - Network should be 1 GBPS min |
| |
| Notes | Lower system configurations may limit performance, data capacity and operation of some features. Faster processor, more memory and faster hard drives will significantly enhance performance. |
Get Support