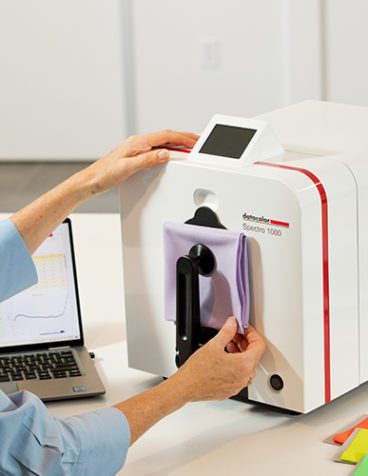
One of the key elements of a successful digital color management program is achieving accurate and repeatable color sample measurements. If we do not develop a good technique to measure color samples, we will considerably reduce the accuracy of our color recipes, and we’ll have inconsistent results in the areas of QC and inspection.
What you’ll learn in this article about measuring color samples
There are many factors that influence color sample measurement. We’re going to go over the most important factors when we measure color . For the sake of this article, we’ve divided them into two categories:
Sample properties
Instrument configuration
For samples, we are going to go over the following aspects:
Recommended standard conditions for temperature and humidity and sample conditioning. We will discuss what is the optimal number of folds or layers for a good color measurement technique, the correct positioning of samples when we measure color, and the number of measurements you should take of each sample. Finally, we will go over the different types of textile materials and the recommended presentations for each one of them.
For instrument configuration, we will cover the importance of maintaining consistent color measurement instrument conditions across all the supply chain partners involved in exchanging color data.
We’ll also go over aperture size, specular and UV conditions and different geometries available today‚ including new hyperspectral imaging technology.
What is the recommended temperature and humidity for sample conditioning?
Most textile standards used to evaluate colors visually and instrumentally recommend that all areas used to evaluate color should be conditioned to laboratory standard conditions. This is a temperature of 21 °C or 70 °F and relative humidity of 65%.
Maintaining large areas used in color measurement evaluation under controlled conditions is sometimes very expensive, so a conditioning cabinet is a better alternative. The conditioning cabinet allows for consistent conditions, regardless of the temperature or humidity in the room.
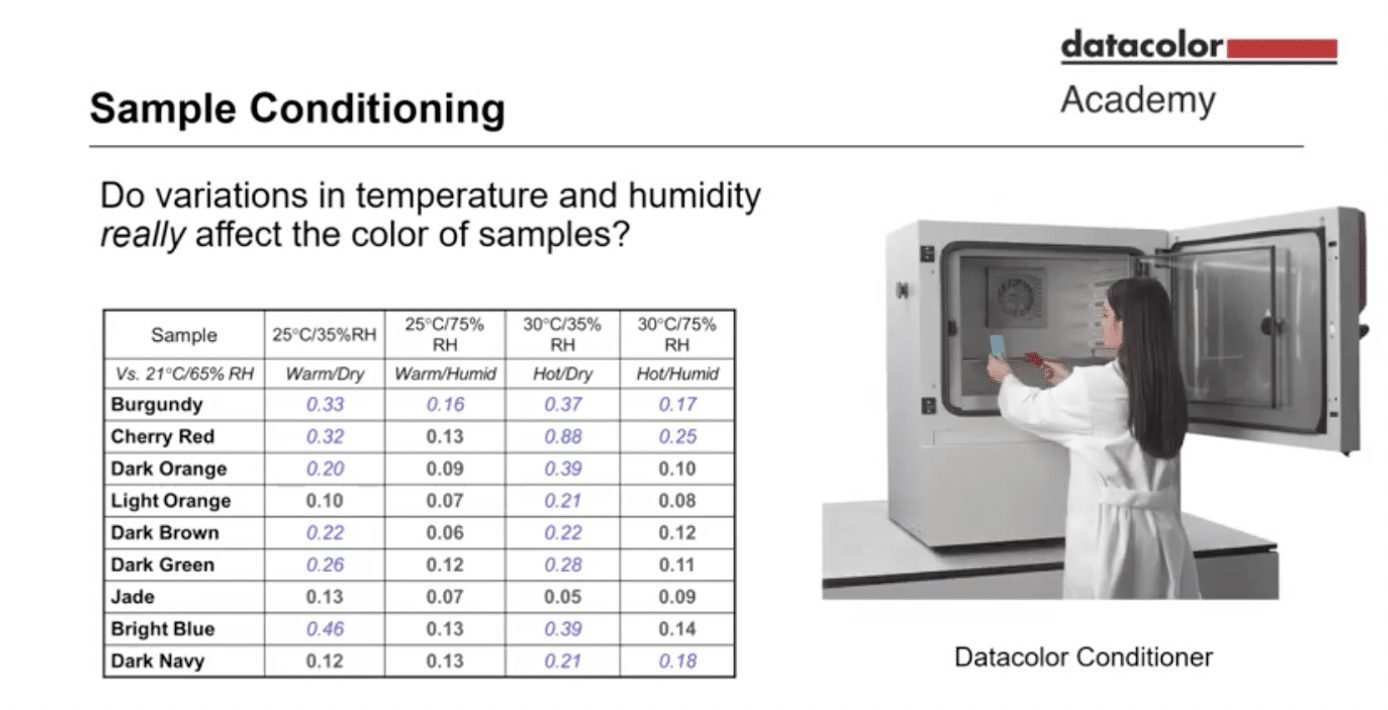
Do variations in temperature and humidity impact sample colors?
We frequently get this question from customers. In the table shown below, you’ll see a study that was done with nine color samples including browns, reds, oranges, greens and blues. These samples were measured with a spectrophotometer at different conditions of temperature and humidity.
The standards were measured at laboratory standard conditions and the samples were measured at different conditions of temperature and humidity. The table shows the color variations that could be seen when those parameters were moved in one direction or another.
As you can see, the values in blue are showing a Delta E above 0.15 CMC units. You can also see that the conditions that affected the color the most were lower humidity at 35%. When temperature and humidity were increased, it did not seem to affect the colors that much.
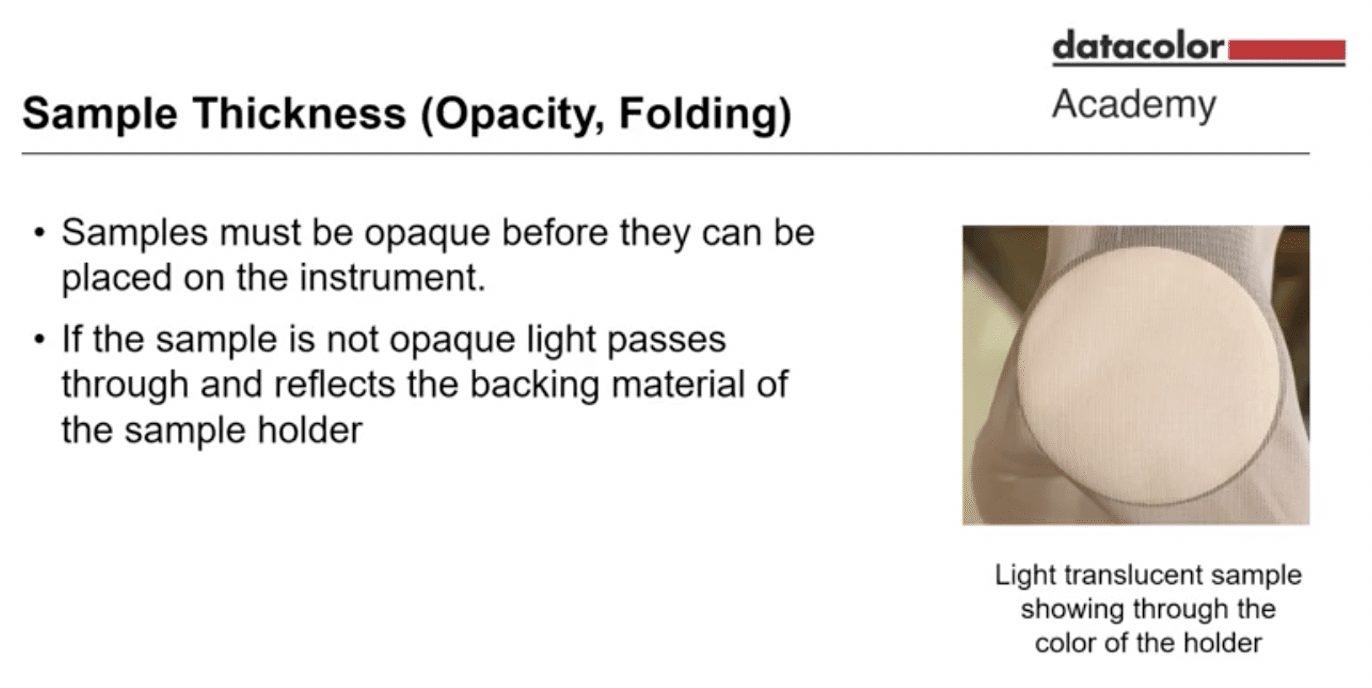
What is the best sample thickness for accurate color measurement?
If a sample is very translucent when placed into your instrument, you may capture the reflection from the sample holder.
In the image below, you can see a light pink chiffon sample. When we place it with one layer, we also capture the sample pad. The only way to accurately measure this sample is by folding it multiple times. In this case we need many layers to bring the material to opaque, but not so many layers that it will protrude inside the sphere.
In cases like this, you can place one or two layers with a backing of a white tile, like the one we use to calibrate instruments. It is important to note, however, that this can only be used when the standard and the batch are evaluated in the same conditions and with the same white tile backing.
If we want to capture absolute values of the color or to match a color, this method will not work. For typical knitted or woven materials, folding the sample one or two times will be enough to achieve opacity.
How to account for variation within a sample?
How can we account for variations in the fabric construction, in the directionality of yarns, or if we have unlevel dyeing? The following video illustrates a good technique for measuring samples like this.
Here is what we did in this case:
Fold the sample one time, then fold it a second time
Place it into the instrument and take the first measurement.
When the first measurement is completed, rotate the sample 90 degrees and measure the back side
Take the sample and re-fold it in the other direction and repeat the process, first at zero degrees and then at 90 degrees to measure the other side.
For materials with more texture (such as high-pile fabrics), the best approach is to measure the sample, remove it from the color measurement instrument, then remeasure it with a variation of less than 0.15 Delta E CMS units between measurements.
For a demo of how to determine the ideal number of measurements using Datacolor Color Measurement Tools, you can watch the video below:
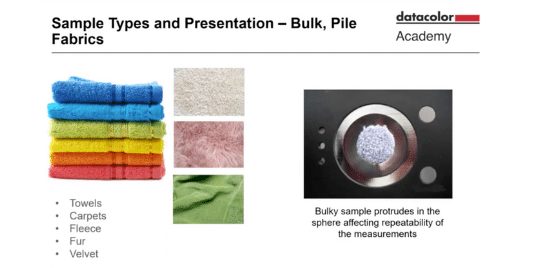
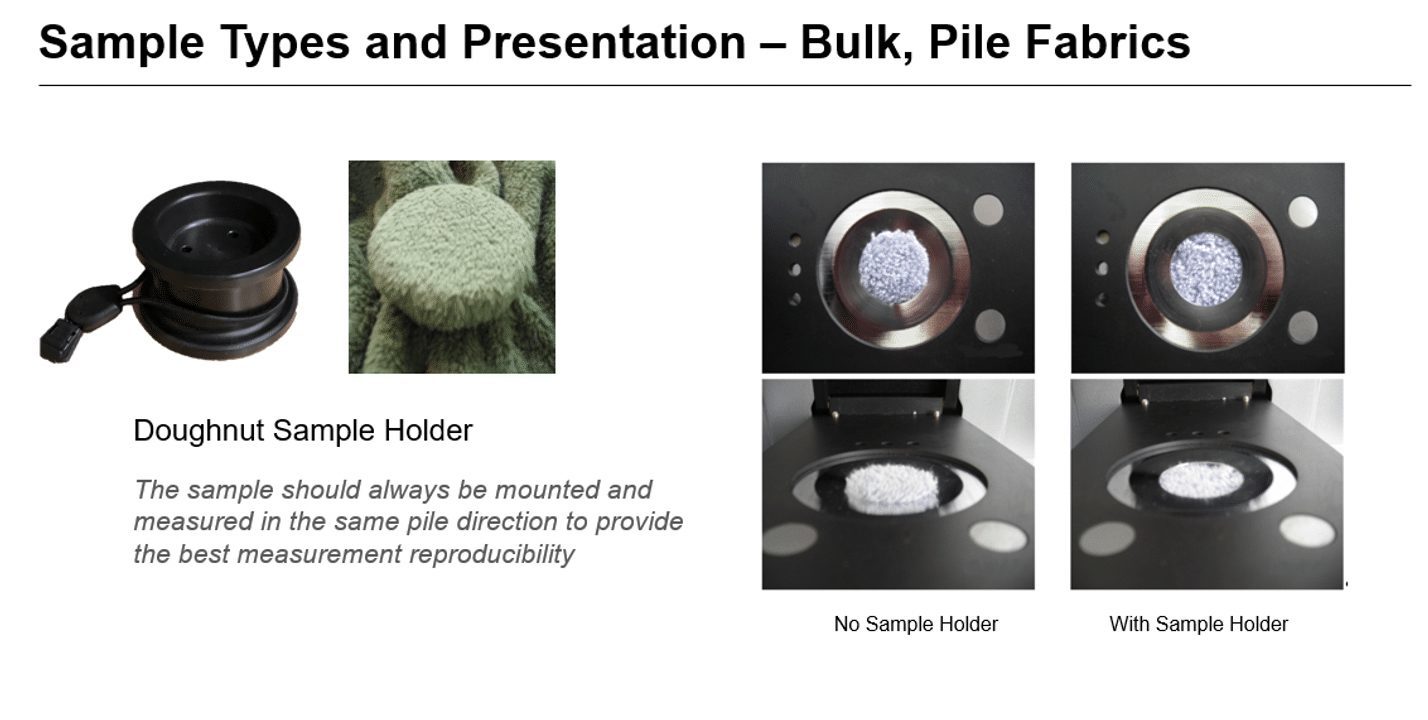
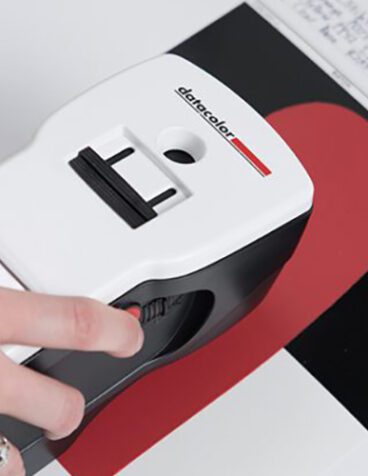
How to measure the color of towels, carpets, fleece, velvet and more?
To measure these types of materials, you’ll want to use a sample holder.
We call the sample holder pictured above a doughnut and it consists of a cylinder and a rubber band. We place the sample on top of the cylinder and use the rubber band to keep the sample uniform and flat while measurements are taken. Even with a sample holder, these types of materials also require multiple measurements with rotation to account for texture.
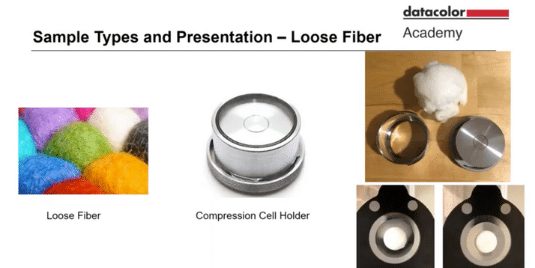
How to measure the color of loose fibers?
These types of samples will also protrude into the sphere. The pressure applied by a sample holder will also vary depending on its usage. In this case, we recommend using a compression cell holder, pictured above. To use it, place an exact weight amount of the fiber on the right side (plunger) of the sample holder. Then, close it tightly. Now the sample can be presented without protrusion into the sphere.
It’s recommended that you use the same amount of fabric, weight and fiber each time and also measure the sample specular excluded to remove the glossy effect of the glass.
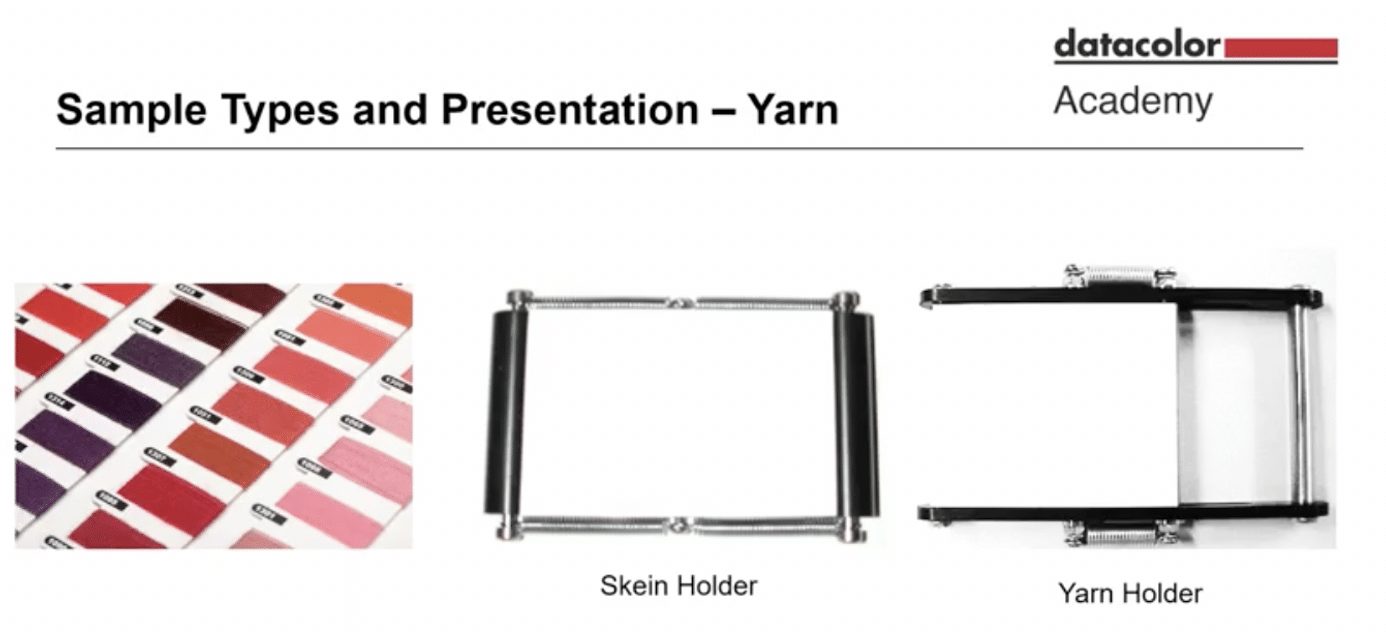
How to measure the color of yarn?
For yarns, we could use the compression holder mentioned above, or we could prepare the sample in a way that is proven to produce repeatable results. One of these methods involves winding the yarn around a card as shown below. The other two presentations involve using a skein or yarn holder, depending on your sample. The yarn is placed on the holder and the springs allow you to clamp the yarn in place.
Important note: When using these holders, make sure a controlled tension is applied. If you have variations in tension, you will also have differences in color.
Now that we have covered recommendations for preparing samples for measurement, let’s talk about how important it is to maintain consistent color measurement instrument setup when sending color data across the supply chain.
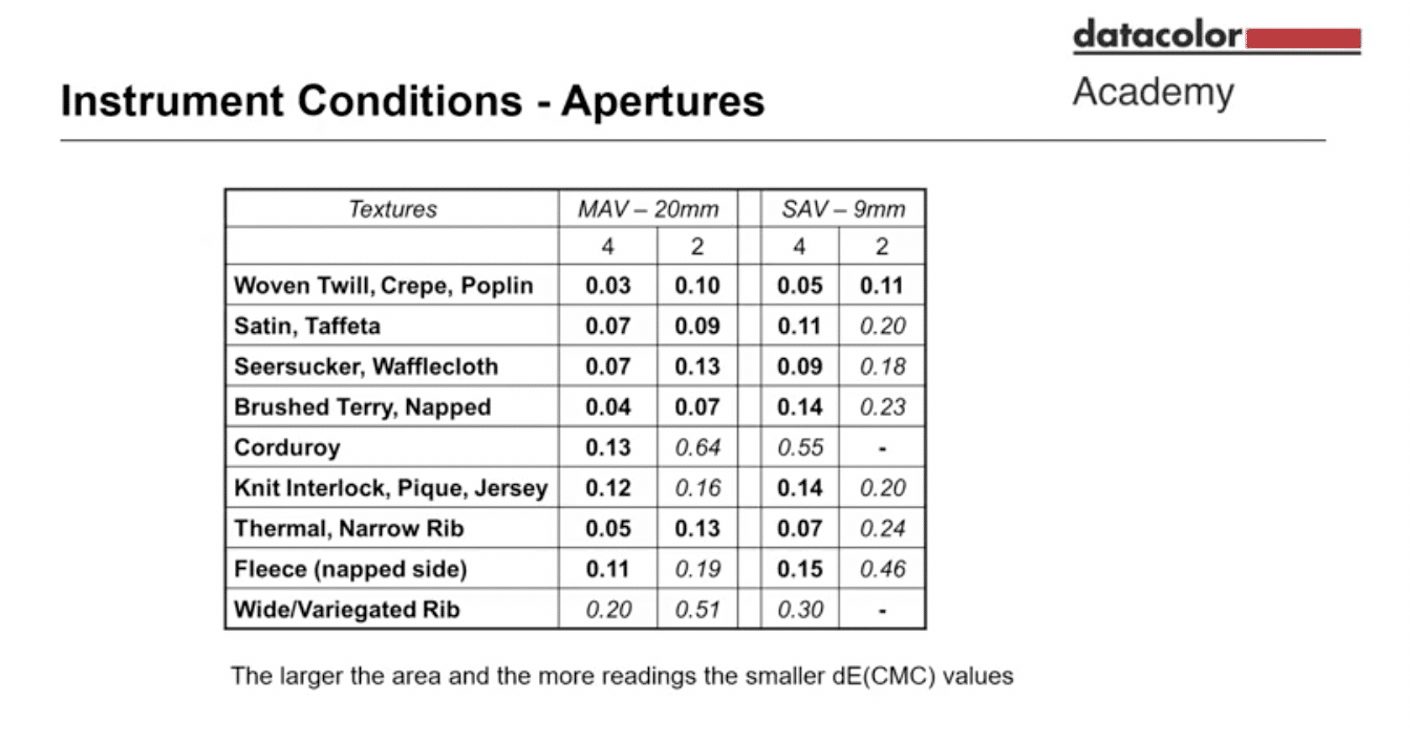
What is the recommended aperture for textile samples?
The first thing to consider here is the size of your samples. Sometimes we don’t have any alternative other than using very small aperture sizes because the sample is very small. The larger the aperture is, the better off you are. We will see many brand programs where the recommendation is to use a medium or large aperture.
In the table above, you can see the effect of using a medium aperture view versus a small aperture view. We’re talking about the difference between 20 millimeters and 9 millimeters. We are also measuring samples that range from a very uniform woven sample to a more complicated texture like corduroy or a variegated rib or fleece.
These samples were measured using both apertures and with an average of four readings or two readings. The values shown in bold are all equal or less than 0.15 Delta E CMS, which is a good technique. The values not in bold are the ones that exceed 0.15.
When we only do two readings or we measure in a small aperture view, we exceed values when we work with fewer readings or a small area view. In general, the larger the area and the more readings we average, the smaller the Delta E CMS values reporting will be.
What UV condition should you use for color measurement?
Should you calibrate your color measurement instrument for UV? Should you include UV? Should you exclude it? In general, many brand programs recommend measuring color samples with UV excluded.
When we talk about optical brighteners, white materials or fluorescent white materials that are treated with whitening agents, the recommendation is to calibrate the instrument for UV.
What are the impacts of different color measurement instrument geometries?
You might already know that there is no compatibility between a spherical geometry and a directional geometry. Most brands recommend diffuse 8-degree geometry, but if some of their suppliers are measured with 45/0, there will not be good agreement between the two measurements.
For this reason, another important aspect to consider when communicating color digitally is using the same geometries.
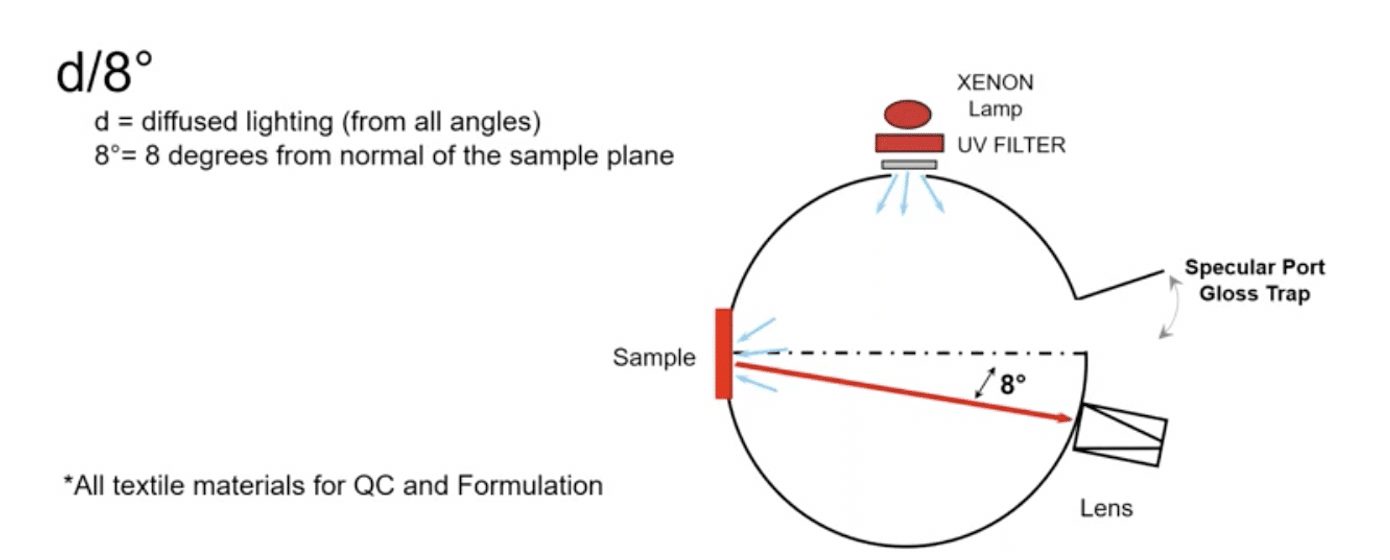
What is Diffuse/8 Geometry?
The image above is a very simplified diagram of a spherical d/8° (diffuse 8) geometry. It’s called diffuse 8 because the light source first hits the walls of a highly reflective coated sphere and this diffuse light illuminates the sample. The detection happens at eight degrees of the sample.
This geometry also offers a specular port or gloss trap that can be included or excluded depending on the type of samples.
When the port is closed, we are including the gloss or specular component in the measurement.
When the port is open, we are excluding the specular component or gloss from that measurement.
This geometry is typically used in the textile world for QC and formulation.
What is Diffuse/0 Geometry?
This geometry follows the same principles as above. There is diffused lighting illuminating the sample. But in this case, the detector is located at 0 degrees of the sample. This geometry does not have a specular port, so all the measurements are specular excluded by default.
This geometry is typically recommended for paper and paper manufacturing products. Some color standards in the textile industry could recommend diffuse zero degrees as well.
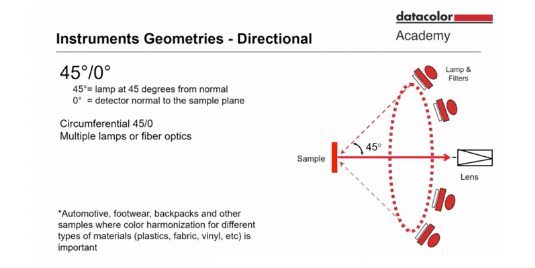
What are Directional Geometries?
Here we’ll talk about 45°/0° and 0°/45° geometries.
For 45°/0°, the sample is illuminated at 45 degrees, and the detector is at zero degrees from the sample. For 0°/45°, the illumination happens at zero degrees and the lens is capturing the information coming from the sample at 45 degrees.
45°/0° and 0°/45 are typically recommended for automotive or food applications. They might also be used with color samples that have multiple components made of different materials.
Let’s say you have textile, plastic and vinyl components of the final product and they all have to be the same color. But we know the appearance of these materials are different. 45°/0° geometry helps account for that appearance aspect.
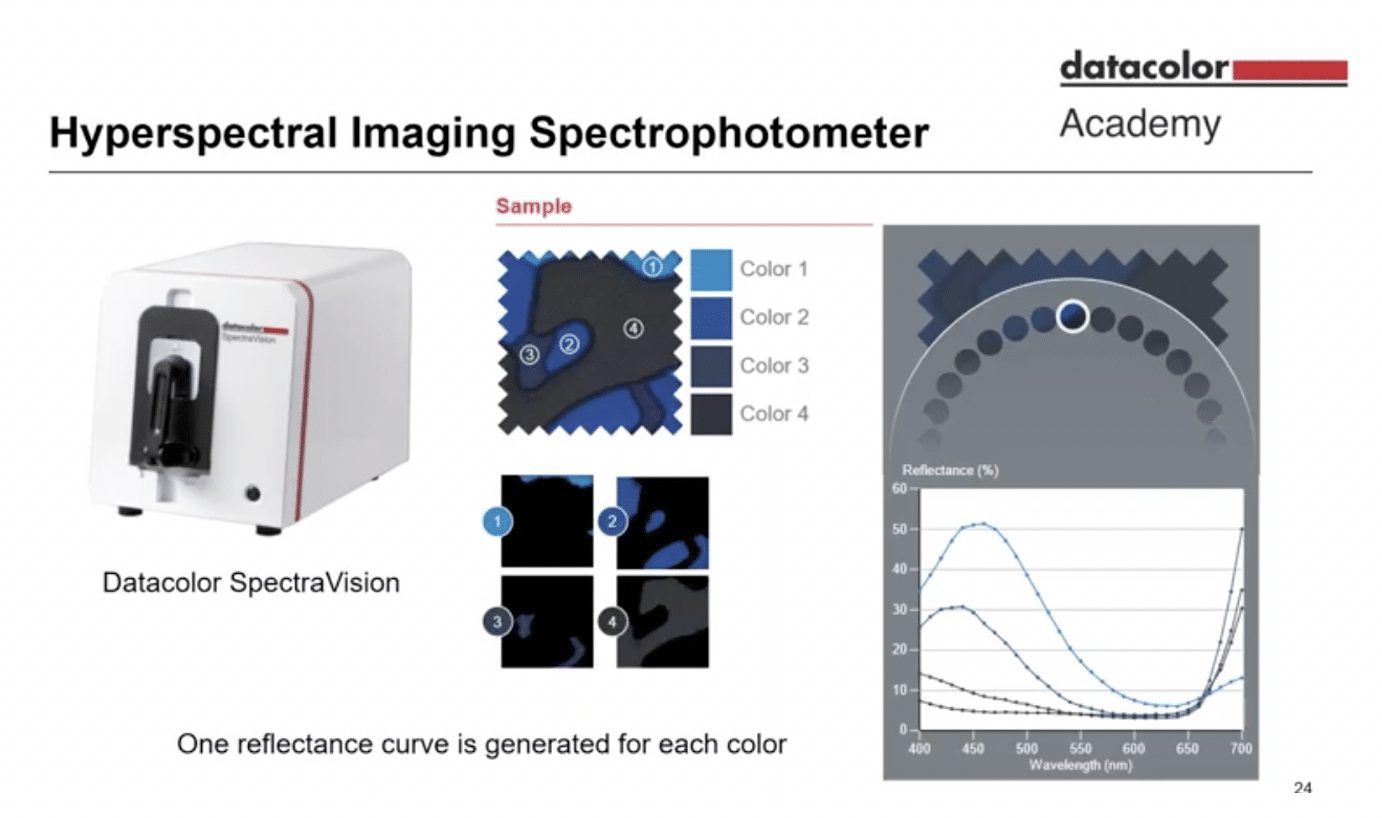
How to Measure Multi-Color Prints, Lace or Zippers?
So far, we’ve discussed measurement of materials that are a single color and texture. But what about multi-color prints, lace or all the accessories used for garments like zippers, trims and buttons?
In the example above, we have a sample with four colors. A hyperspectral imaging spectrophotometer will take 31 measurements or 31 pictures of the sample. Each of these are taken at different wavelengths from 400 to 700 nanometers.
Every time this instrument takes a picture, it captures the pixels of the whole sample and separates the color. This separation enables the system to determine a reflectance curve for each of the colors in the print.
This approach also works for lace. Once the colors are separated, you can discard the background and only generate a reflectance curve for the actual lace material and see the color difference between the standard and the lace sample.
How will you improve your color management program?